A connected view
Turn user-facing indicators into a small set of checks with named owners and clear thresholds.
Read moreMonitoring should lead to understanding, not another wall of charts. Explore practical methods, runbooks and a small reliability calculation tool.
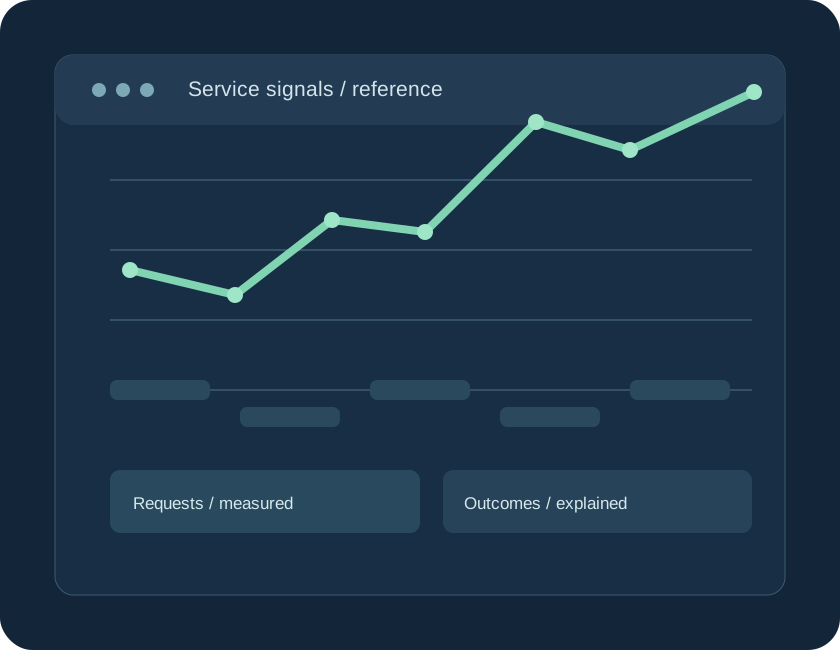
A useful monitoring practice begins with the outcome someone is waiting for. Uptime, request latency and failed work are meaningful because they describe a user experience, not because they fill a dashboard.
Infrastructure numbers help explain a failure. They should not be mistaken for proof that a service is healthy.
Turn user-facing indicators into a small set of checks with named owners and clear thresholds.
Read moreLearn when to observe availability, latency, errors and saturation, and how to define measurements.
Read moreKeep a practical response note near the signal so the first decision is not made under pressure.
Read moreThe budget lab uses numbers you enter. It does not fetch production metrics, create an account or report your input to a remote service.
Open budget lab